分面逻辑回归#
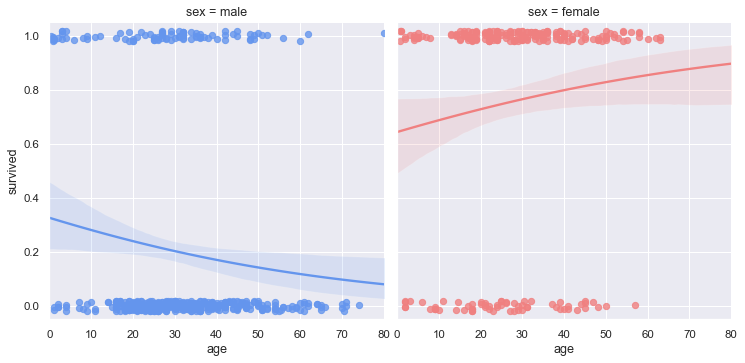
使用 seaborn 组件: set_theme(), load_dataset(), lmplot()
import seaborn as sns
sns.set_theme(style="darkgrid")

# Load the example Titanic dataset
df = sns.load_dataset("titanic")

# Make a custom palette with gendered colors
pal = dict(male="#6495ED", female="#F08080")

# Show the survival probability as a function of age and sex
g = sns.lmplot(x="age", y="survived", col="sex", hue="sex", data=df,
               palette=pal, y_jitter=.02, logistic=True, truncate=False)
g.set(xlim=(0, 80), ylim=(-.05, 1.05))