带误差带的时间序列图#
使用的 seaborn 组件: set_theme(),load_dataset(),lineplot()
import seaborn as sns
sns.set_theme(style="darkgrid")
# Load an example dataset with long-form data
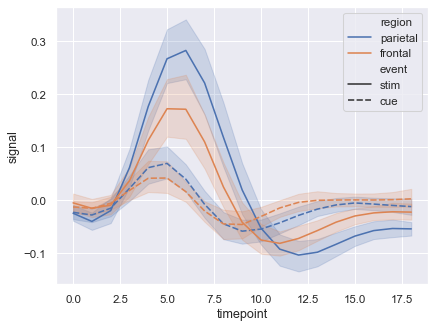
fmri = sns.load_dataset("fmri")
# Plot the responses for different events and regions
sns.lineplot(x="timepoint", y="signal",
hue="region", style="event",
data=fmri)