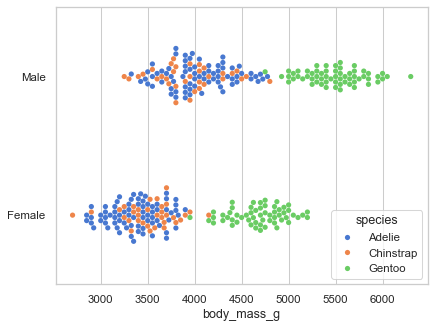
带有分类变量的散点图#

使用的 seaborn 组件: set_theme(), load_dataset(), swarmplot()
import seaborn as sns
sns.set_theme(style="whitegrid", palette="muted")

# Load the penguins dataset
df = sns.load_dataset("penguins")

# Draw a categorical scatterplot to show each observation
ax = sns.swarmplot(data=df, x="body_mass_g", y="sex", hue="species")
ax.set(ylabel="")