seaborn.set_theme#
- seaborn.set_theme(context='notebook', style='darkgrid', palette='deep', font='sans-serif', font_scale=1, color_codes=True, rc=None)#
为所有 matplotlib 和 seaborn 图表设置视觉主题的各个方面。
此函数使用 matplotlib rcParams 系统更改所有使用 matplotlib 的图表的全局默认值。主题被分解成几个不同的参数值集。
- 参数::
- context字符串或字典
缩放参数,请参见
plotting_context().- style字符串或字典
轴样式参数,请参见
axes_style().- palette字符串或序列
调色板,请参见
color_palette().- font字符串
字体系列,请参见 matplotlib 字体管理器。
- font_scale浮点数,可选
独立缩放字体元素大小的单独缩放因子。
- color_codes布尔值
如果
True且palette是一个 seaborn 调色板,则将简写颜色代码(例如“b”,“g”,“r”等)重新映射到此调色板中的颜色。- rc字典或无
rc 参数映射的字典,用于覆盖上述内容。
示例
默认情况下,seaborn 图表将使用 matplotlib rcParams 的当前值绘制。
sns.barplot(x=["A", "B", "C"], y=[1, 3, 2])
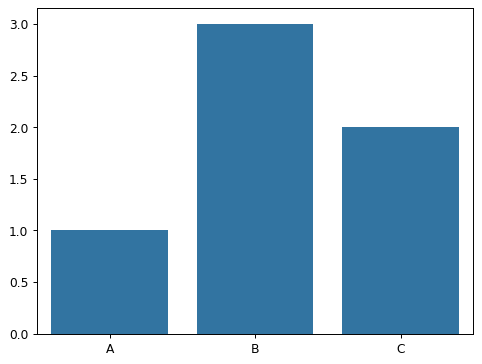
在不带任何参数的情况下调用此函数将激活 seaborn 的“默认”主题。
sns.set_theme()
sns.barplot(x=["A", "B", "C"], y=[1, 3, 2])
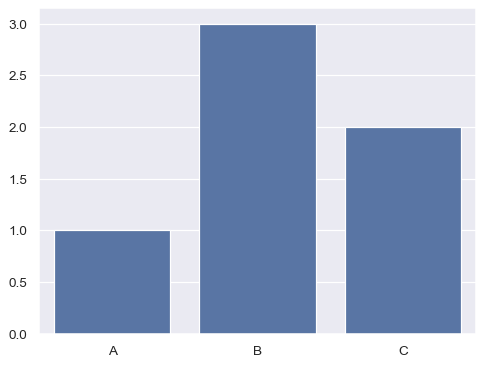
请注意,这将对所有 matplotlib 图表生效,包括那些不是使用 seaborn 绘制的图表。
plt.bar(["A", "B", "C"], [1, 3, 2])
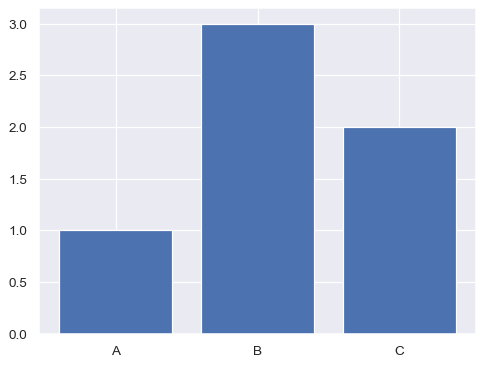
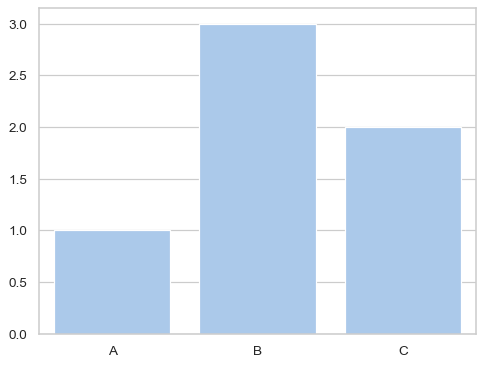
seaborn 主题被分解成几个不同的参数集,您可以独立控制这些参数集。
sns.set_theme(style="whitegrid", palette="pastel")
sns.barplot(x=["A", "B", "C"], y=[1, 3, 2])
传递
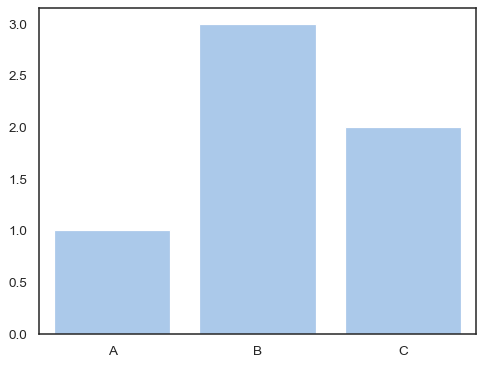
None以保留给定参数集的当前值。sns.set_theme(style="white", palette=None) sns.barplot(x=["A", "B", "C"], y=[1, 3, 2])
您还可以覆盖任何 seaborn 参数或定义作为 matplotlib rc 系统的一部分但未包含在 seaborn 主题中的其他参数。
custom_params = {"axes.spines.right": False, "axes.spines.top": False}
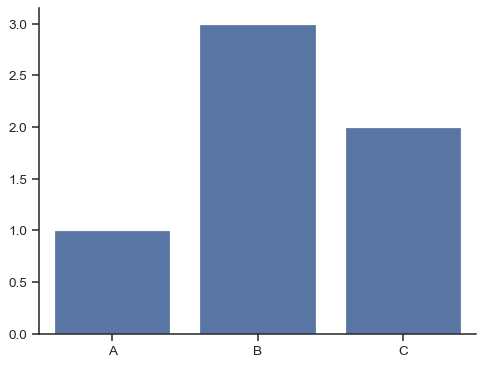
sns.set_theme(style="ticks", rc=custom_params)
sns.barplot(x=["A", "B", "C"], y=[1, 3, 2])
