seaborn.JointGrid#
- class seaborn.JointGrid(data=None, *, x=None, y=None, hue=None, height=6, ratio=5, space=0.2, palette=None, hue_order=None, hue_norm=None, dropna=False, xlim=None, ylim=None, marginal_ticks=False)#
用于绘制具有边际单变量图的双变量图的网格。
可以使用图形级接口
jointplot()绘制许多图。当您需要更多灵活性时,直接使用此类。- __init__(data=None, *, x=None, y=None, hue=None, height=6, ratio=5, space=0.2, palette=None, hue_order=None, hue_norm=None, dropna=False, xlim=None, ylim=None, marginal_ticks=False)#
设置子图网格并存储内部数据,以便轻松绘图。
- 参数:
- data
pandas.DataFrame,numpy.ndarray, 映射或序列 输入数据结构。可以分配给命名变量的长格式向量集合或将被内部重塑的宽格式数据集。
- x, y向量或
data中的键 指定 x 轴和 y 轴位置的变量。
- height数字
图中每个边的尺寸,以英寸为单位(它将是正方形)。
- ratio数字
联合轴高度与边际轴高度的比率。
- space数字
联合轴和边际轴之间的空间
- dropna布尔值
如果为 True,则在绘图之前删除缺失的观察值。
- {x, y}lim数字对
在绘图之前将轴限制设置为这些值。
- marginal_ticks布尔值
如果为 False,则在边际图的计数/密度轴上抑制刻度。
- hue向量或
data中的键 语义变量,映射到它以确定绘图元素的颜色。注意:与
FacetGrid或PairGrid不同,轴级函数必须支持hue才能在JointGrid中使用它。- palette字符串、列表、字典或
matplotlib.colors.Colormap 选择在映射
hue语义时使用的颜色的方法。字符串值传递给color_palette()。列表或字典值意味着分类映射,而颜色映射对象意味着数值映射。- hue_order字符串向量
指定处理和绘制
hue语义的分类级别的顺序。- hue_norm元组或
matplotlib.colors.Normalize 一对值,以数据单位设置归一化范围,或者一个对象,将数据单位映射到 [0, 1] 区间。使用意味着数值映射。
- data
示例
调用构造函数将初始化图形,但不会绘制任何内容
penguins = sns.load_dataset("penguins")
sns.JointGrid(data=penguins, x="bill_length_mm", y="bill_depth_mm")
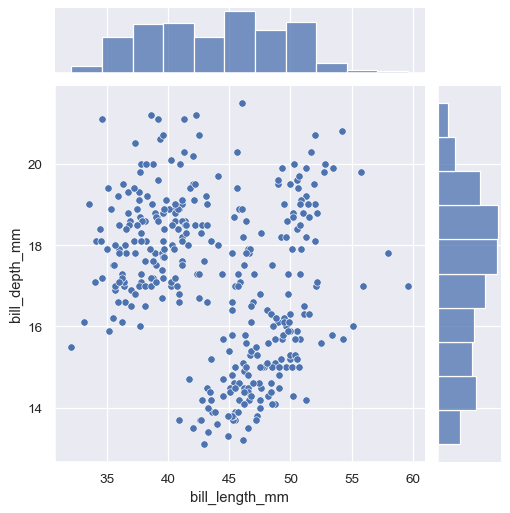
最简单的绘图方法,
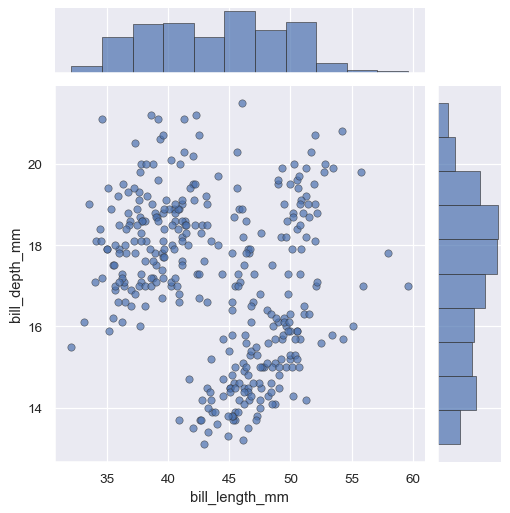
JointGrid.plot()接受一对函数(一个用于联合轴,一个用于两个边缘轴)g = sns.JointGrid(data=penguins, x="bill_length_mm", y="bill_depth_mm") g.plot(sns.scatterplot, sns.histplot)
JointGrid.plot()函数也接受额外的关键字参数,但它将它们传递给这两个函数g = sns.JointGrid(data=penguins, x="bill_length_mm", y="bill_depth_mm") g.plot(sns.scatterplot, sns.histplot, alpha=.7, edgecolor=".2", linewidth=.5)
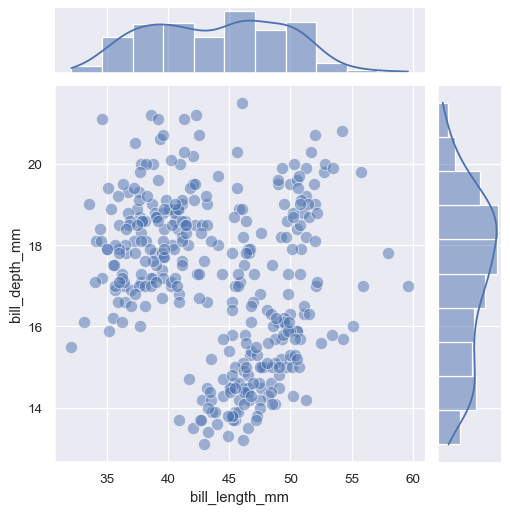
如果你需要将不同的关键字参数传递给每个函数,你将不得不调用
JointGrid.plot_joint()和JointGrid.plot_marginals()g = sns.JointGrid(data=penguins, x="bill_length_mm", y="bill_depth_mm") g.plot_joint(sns.scatterplot, s=100, alpha=.5) g.plot_marginals(sns.histplot, kde=True)
你也可以在不分配任何数据的情况下设置网格
g = sns.JointGrid()
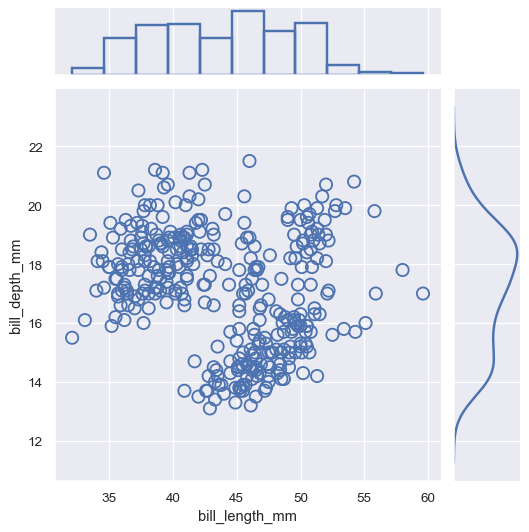
然后你可以通过访问
ax_joint、ax_marg_x和ax_marg_y属性来绘图,这些属性是matplotlib.axes.Axes对象g = sns.JointGrid() x, y = penguins["bill_length_mm"], penguins["bill_depth_mm"] sns.scatterplot(x=x, y=y, ec="b", fc="none", s=100, linewidth=1.5, ax=g.ax_joint) sns.histplot(x=x, fill=False, linewidth=2, ax=g.ax_marg_x) sns.kdeplot(y=y, linewidth=2, ax=g.ax_marg_y)
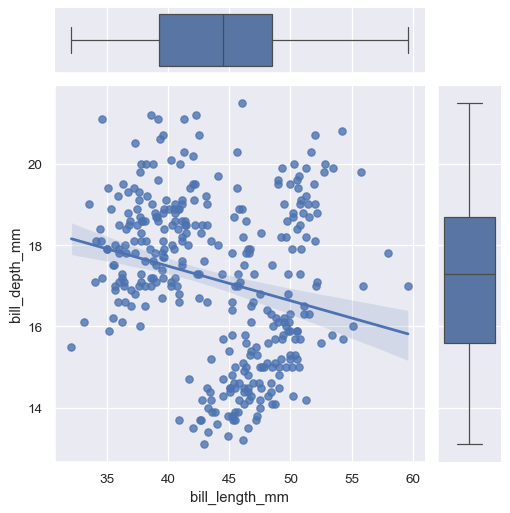
绘图方法可以使用任何接受
x和y变量的 seaborn 函数g = sns.JointGrid(data=penguins, x="bill_length_mm", y="bill_depth_mm") g.plot(sns.regplot, sns.boxplot)
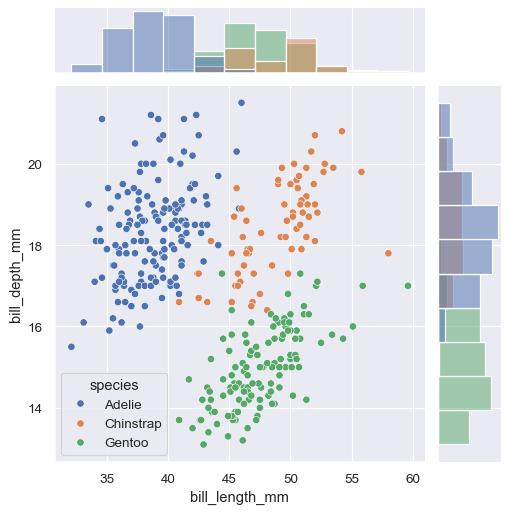
如果这些函数接受一个
hue变量,你可以在调用构造函数时将其分配给hueg = sns.JointGrid(data=penguins, x="bill_length_mm", y="bill_depth_mm", hue="species") g.plot(sns.scatterplot, sns.histplot)
可以使用 :meth:
JointGrid.refline将水平和/或垂直参考线添加到联合和/或边缘轴g = sns.JointGrid(data=penguins, x="bill_length_mm", y="bill_depth_mm") g.plot(sns.scatterplot, sns.histplot) g.refline(x=45, y=16)
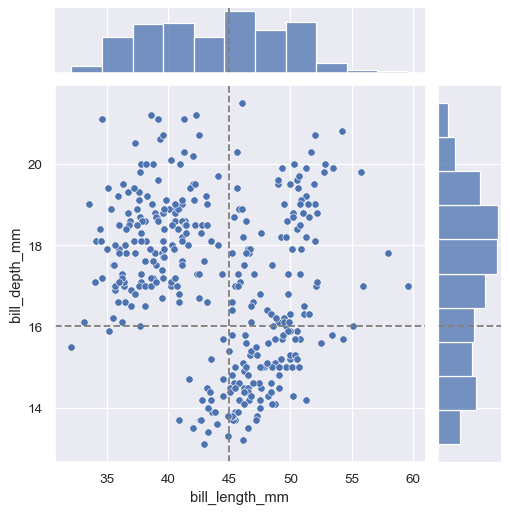
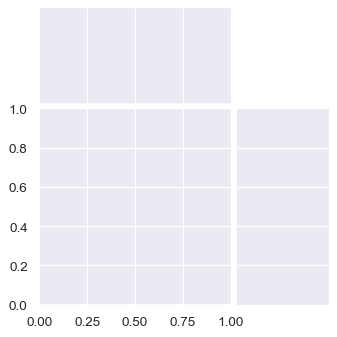
该图形始终为正方形(除非你在 matplotlib 层中调整其大小),但其整体大小和布局是可配置的。大小由
height参数控制。联合和边缘轴之间的相对比例由ratio控制,绘图之间的空间量由space控制sns.JointGrid(height=4, ratio=2, space=.05)
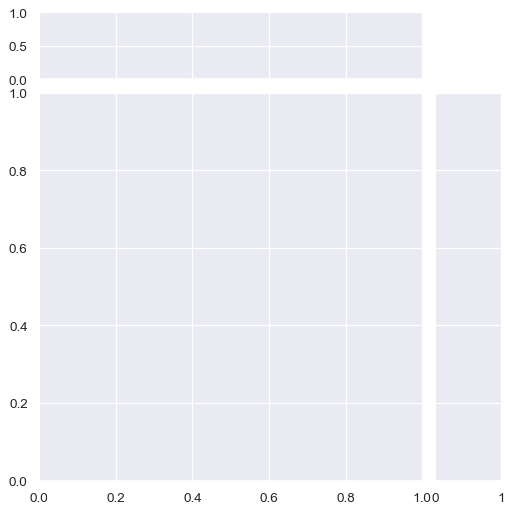
默认情况下,边缘图的密度轴上的刻度被关闭,但这是可以配置的
sns.JointGrid(marginal_ticks=True)
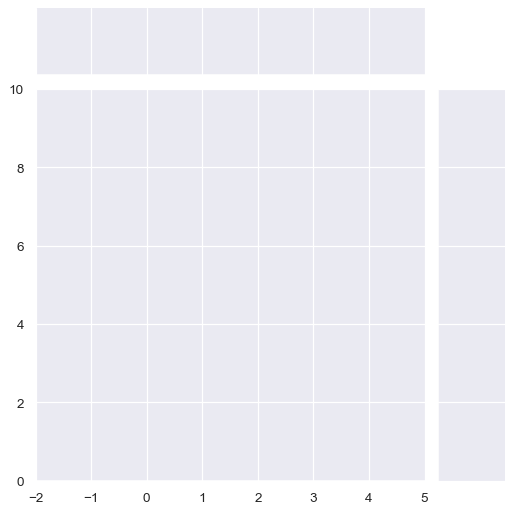
在设置图形时,也可以定义两个数据轴(在所有绘图中共享)上的限制
sns.JointGrid(xlim=(-2, 5), ylim=(0, 10))
方法
__init__([data, x, y, hue, height, ratio, ...])设置子图网格并存储内部数据,以便轻松绘图。
apply(func, *args, **kwargs)将网格传递给用户提供的函数并返回 self。
pipe(func, *args, **kwargs)将网格传递给用户提供的函数并返回其值。
plot(joint_func, marginal_func, **kwargs)通过传递联合和边缘轴的函数来绘制图形。
plot_joint(func, **kwargs)在网格的联合轴上绘制双变量图。
plot_marginals(func, **kwargs)在每个边缘轴上绘制单变量图。
refline(*[, x, y, joint, marginal, color, ...])向联合和/或边缘轴添加参考线。
savefig(*args, **kwargs)保存图形的图像。
set(**kwargs)设置每个子图 Axes 上的属性。
set_axis_labels([xlabel, ylabel])在双变量轴上设置轴标签。
属性
fig已弃用:首选
figure属性。figure访问
matplotlib.figure.Figure对象,该对象位于网格之下。