seaborn.rugplot#
- seaborn.rugplot(data=None, *, x=None, y=None, hue=None, height=0.025, expand_margins=True, palette=None, hue_order=None, hue_norm=None, legend=True, ax=None, **kwargs)#
通过在 x 和 y 轴上绘制刻度来绘制边缘分布。
此函数旨在通过以不显眼的方式显示各个观察值的位置来补充其他绘图。
- 参数:
- data
pandas.DataFrame,numpy.ndarray, 映射或序列 输入数据结构。可以分配给命名变量的长格式向量集合,或者将被内部重塑的宽格式数据集。
- x, y向量或
data中的键 指定 x 和 y 轴上位置的变量。
- hue向量或
data中的键 映射以确定绘图元素颜色的语义变量。
- heightfloat
每个地毯元素覆盖的轴范围比例。可以为负数。
- expand_marginsbool
如果为 True,则将轴边距增加地毯的高度,以避免与其他元素重叠。
- palette字符串、列表、字典或
matplotlib.colors.Colormap 选择用于映射
hue语义的颜色方法。字符串值传递给color_palette()。列表或字典值意味着分类映射,而颜色图对象意味着数字映射。- hue_order字符串向量
指定
hue语义的分类级别的处理和绘制顺序。- hue_norm元组或
matplotlib.colors.Normalize 可以是一对值,用于设置数据单位中的归一化范围,也可以是将数据单位映射到 [0, 1] 区间的对象。使用意味着数字映射。
- legendbool
如果为 False,则不添加语义变量的图例。
- ax
matplotlib.axes.Axes 绘图的预先存在的轴。否则,在内部调用
matplotlib.pyplot.gca()。- kwargs
其他关键字参数将传递给
matplotlib.collections.LineCollection()
- data
- 返回值:
matplotlib.axes.Axes包含绘图的 matplotlib 轴。
示例
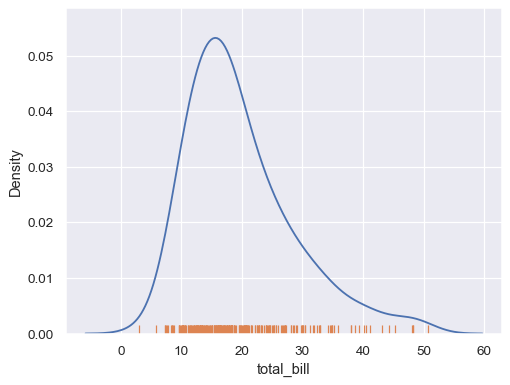
在其中一个轴上添加地毯
import seaborn as sns; sns.set_theme()
tips = sns.load_dataset("tips")
sns.kdeplot(data=tips, x="total_bill")
sns.rugplot(data=tips, x="total_bill")
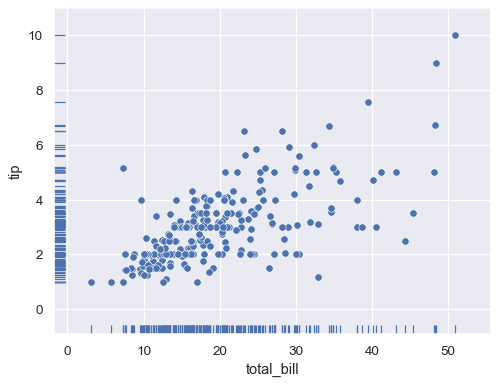
在两个轴上添加地毯
sns.scatterplot(data=tips, x="total_bill", y="tip")
sns.rugplot(data=tips, x="total_bill", y="tip")
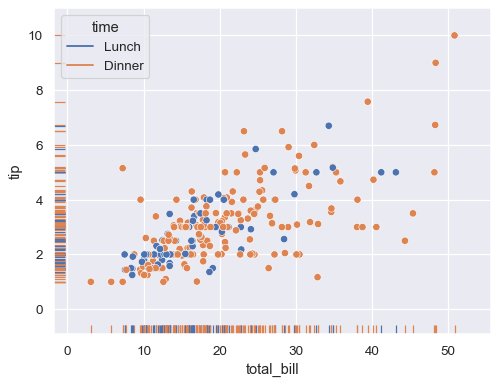
使用色调映射表示第三个变量
sns.scatterplot(data=tips, x="total_bill", y="tip", hue="time")
sns.rugplot(data=tips, x="total_bill", y="tip", hue="time")
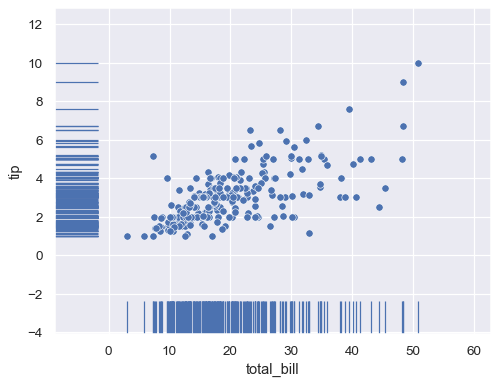
绘制一个更高的地毯
sns.scatterplot(data=tips, x="total_bill", y="tip")
sns.rugplot(data=tips, x="total_bill", y="tip", height=.1)
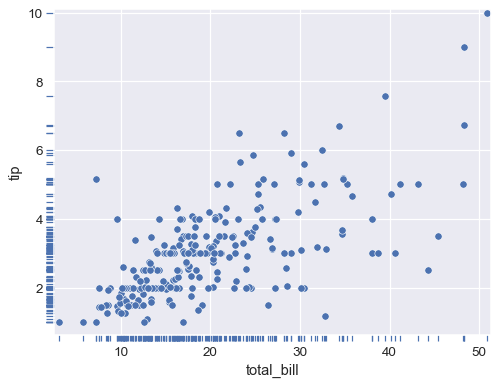
将地毯放在轴之外
sns.scatterplot(data=tips, x="total_bill", y="tip")
sns.rugplot(data=tips, x="total_bill", y="tip", height=-.02, clip_on=False)
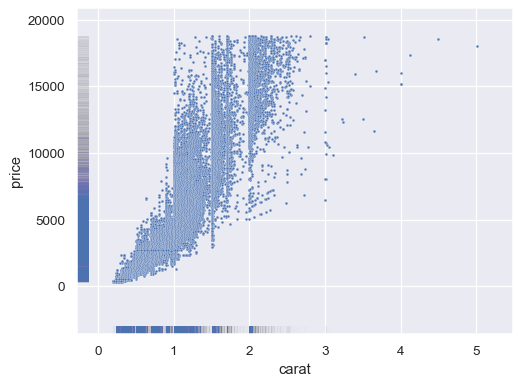
使用更细的线和 alpha 混合显示较大数据集的密度
diamonds = sns.load_dataset("diamonds")
sns.scatterplot(data=diamonds, x="carat", y="price", s=5)
sns.rugplot(data=diamonds, x="carat", y="price", lw=1, alpha=.005)
