seaborn.objects.Path#
- class seaborn.objects.Path(artist_kws=<factory>, color=<'C0'>, alpha=<1>, linewidth=<rc:lines.linewidth>, linestyle=<rc:lines.linestyle>, marker=<rc:lines.marker>, pointsize=<rc:lines.markersize>, fillcolor=<depend:color>, edgecolor=<depend:color>, edgewidth=<rc:lines.markeredgewidth>)#
连接数据点(按其出现的顺序)的标记。
示例
与
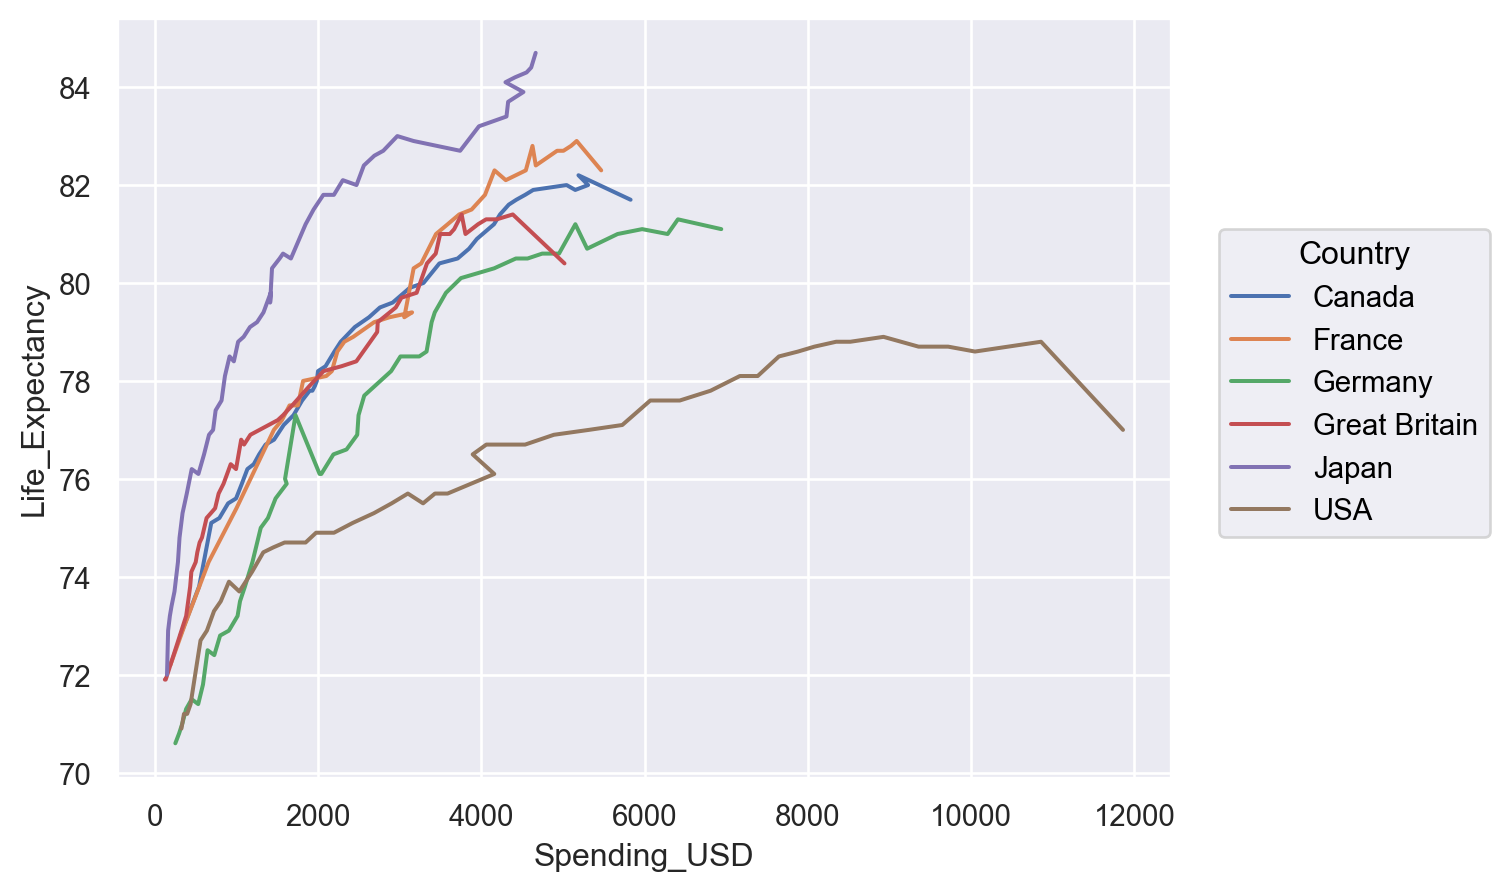
Line不同,此标记不会在绘图之前对观测值进行排序,使其适合绘制通过变量空间的轨迹。p = so.Plot(healthexp, "Spending_USD", "Life_Expectancy", color="Country") p.add(so.Path())

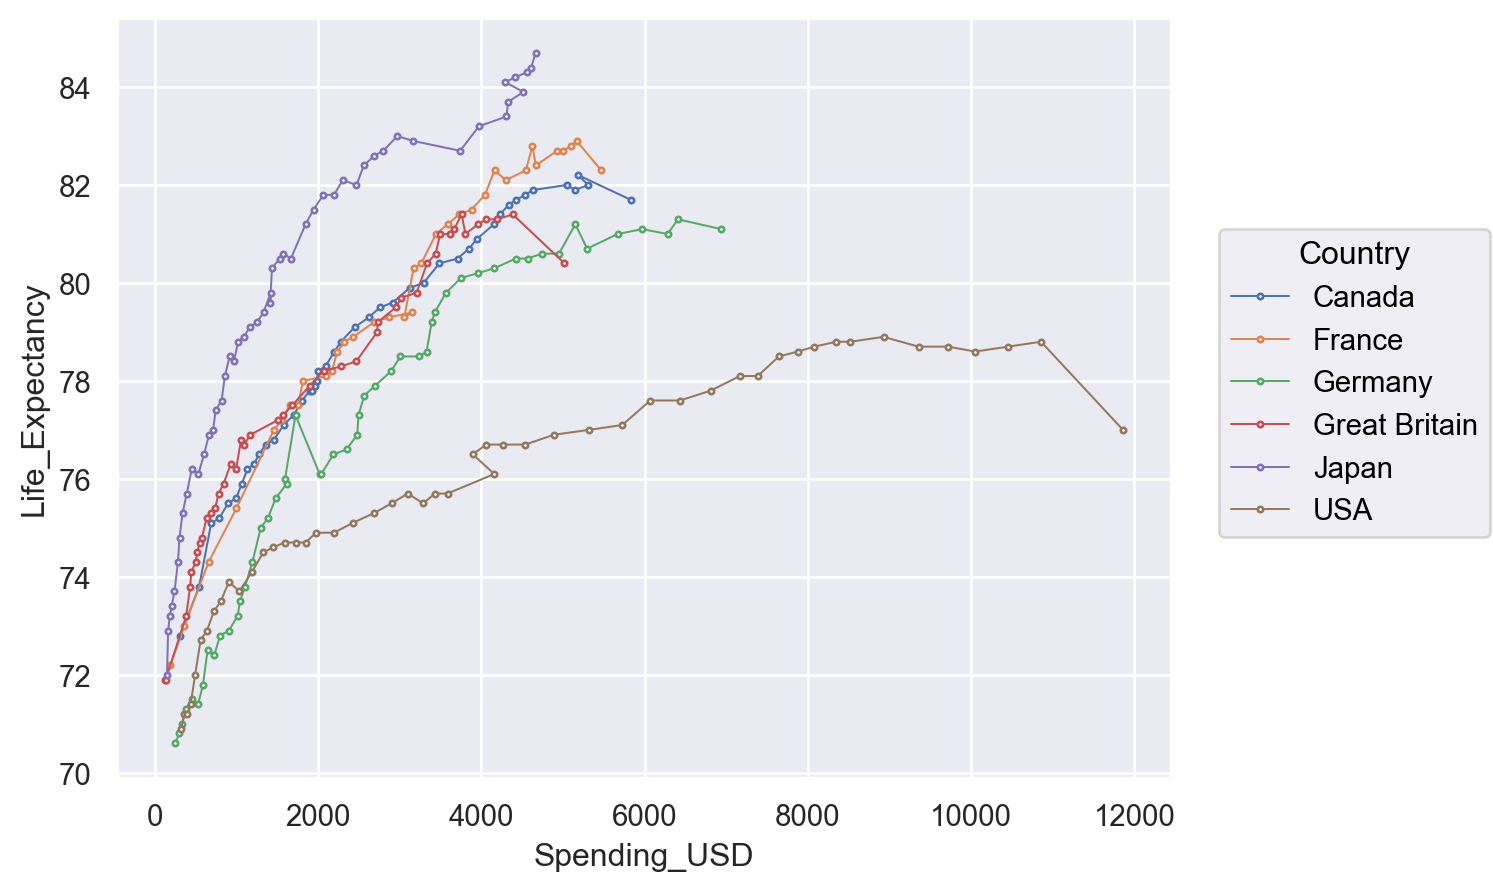
否则,它提供相同的选项集,包括可以设置或映射的许多属性。
p.add(so.Path(marker="o", pointsize=2, linewidth=.75, fillcolor="w"))
