seaborn.jointplot#
- seaborn.jointplot(data=None, *, x=None, y=None, hue=None, kind='scatter', height=6, ratio=5, space=0.2, dropna=False, xlim=None, ylim=None, color=None, palette=None, hue_order=None, hue_norm=None, marginal_ticks=False, joint_kws=None, marginal_kws=None, **kwargs)#
绘制具有双变量和单变量图形的两个变量的图。
此函数提供了一个方便的接口到
JointGrid类,并带有几种预设的绘图类型。这旨在成为一个相当轻量级的包装器;如果你需要更多灵活性,你应该直接使用JointGrid。- 参数:
- data
pandas.DataFrame,numpy.ndarray, mapping, 或 sequence 输入数据结构。可以分配给命名变量的向量集合的长格式,或者将被内部重塑的宽格式数据集。
- x, y向量或
data中的键 指定 x 和 y 轴上位置的变量。
- hue向量或
data中的键 映射以确定绘图元素颜色的语义变量。
- kind{ “scatter” | “kde” | “hist” | “hex” | “reg” | “resid” }
要绘制的绘图类型。有关基础函数的参考,请参见示例。
- height数值
图形的大小(它将是正方形)。
- ratio数值
联合轴高度与边缘轴高度的比率。
- space数值
联合轴和边缘轴之间的空间
- dropna布尔值
如果为 True,则删除
x和y中缺失的观测值。- {x, y}lim数字对
在绘图之前设置的轴限制。
- color
matplotlib color 当不使用色调映射时使用的单个颜色规范。否则,绘图将尝试连接到 matplotlib 属性循环。
- palette字符串、列表、字典或
matplotlib.colors.Colormap 在映射
hue语义时选择要使用的颜色方法。字符串值被传递到color_palette()。列表或字典值意味着分类映射,而色图对象意味着数值映射。- hue_order字符串向量
指定处理和绘制
hue语义的分类级别的顺序。- hue_norm元组或
matplotlib.colors.Normalize 可以是设置数据单位中归一化范围的值对,也可以是将数据单位映射到 [0, 1] 区间的对象。使用意味着数值映射。
- marginal_ticks布尔值
如果为 False,则抑制边缘图上计数/密度轴上的刻度。
- {joint, marginal}_kws字典
绘图组件的其他关键字参数。
- kwargs
其他关键字参数被传递到用于在联合轴上绘制绘图的函数,优先于
joint_kws字典中的项目。
- data
- 返回值:
JointGrid管理多个子图的对象,这些子图对应于用于绘制双变量关系或分布的联合轴和边缘轴。
示例
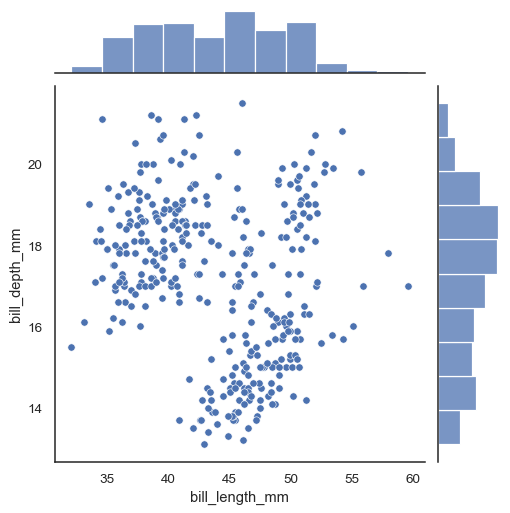
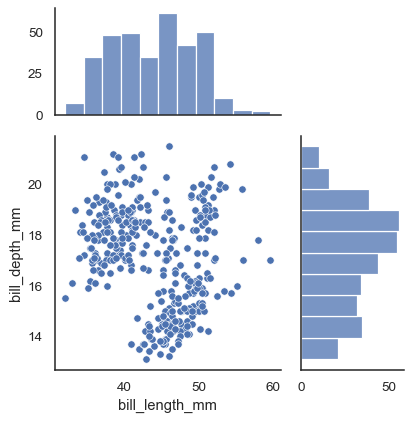
在最简单的调用中,将
x和y分配给创建散点图(使用scatterplot())以及边缘直方图(使用histplot())penguins = sns.load_dataset("penguins") sns.jointplot(data=penguins, x="bill_length_mm", y="bill_depth_mm")
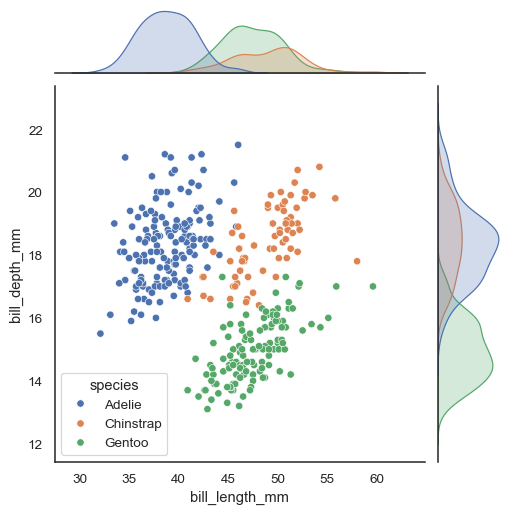
为
hue变量赋值将为散点图添加条件颜色,并在边缘轴上绘制单独的密度曲线(使用kdeplot())。sns.jointplot(data=penguins, x="bill_length_mm", y="bill_depth_mm", hue="species")
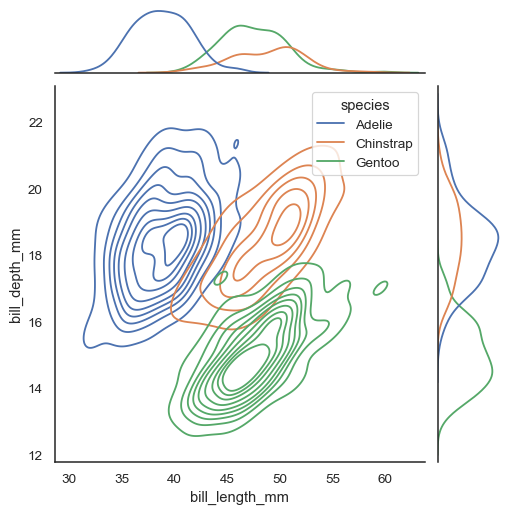
通过
kind参数,可以使用多种不同的绘图方法。将kind="kde"设置为将绘制双变量和单变量 KDE。sns.jointplot(data=penguins, x="bill_length_mm", y="bill_depth_mm", hue="species", kind="kde")
将
kind="reg"设置为添加线性回归拟合(使用regplot())和单变量 KDE 曲线。sns.jointplot(data=penguins, x="bill_length_mm", y="bill_depth_mm", kind="reg")
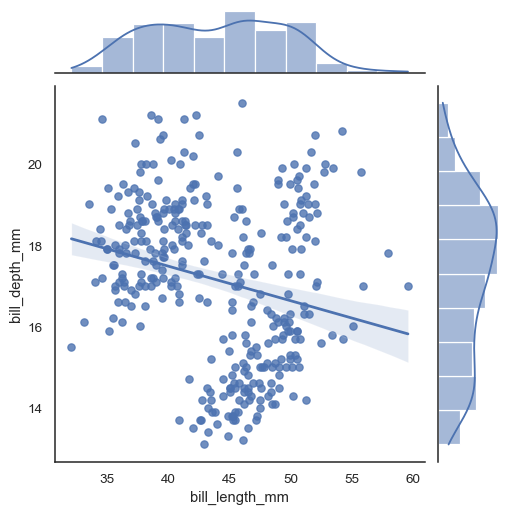
还有两种选择用于对联合分布进行基于 bin 的可视化。第一个选择是使用
kind="hist",它在所有轴上使用histplot()。sns.jointplot(data=penguins, x="bill_length_mm", y="bill_depth_mm", kind="hist")
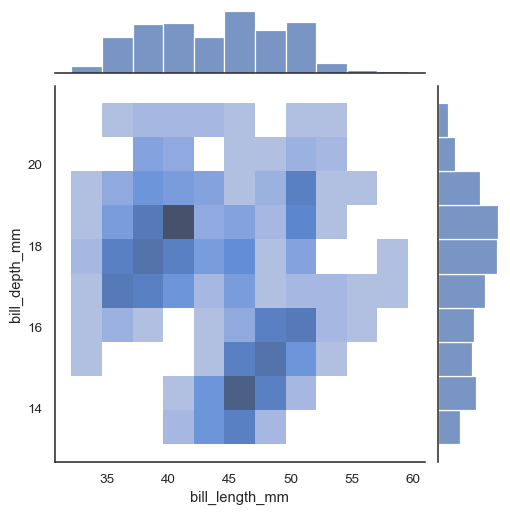
或者,将
kind="hex"设置为将使用matplotlib.axes.Axes.hexbin()计算使用六边形 bin 的双变量直方图。sns.jointplot(data=penguins, x="bill_length_mm", y="bill_depth_mm", kind="hex")
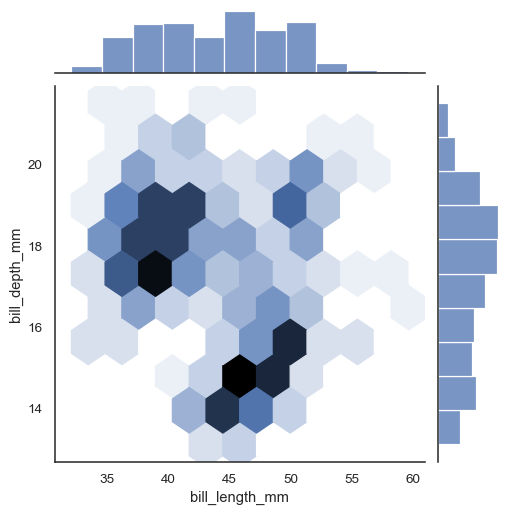
可以将额外的关键字参数传递给底层绘图。
sns.jointplot(
    data=penguins, x="bill_length_mm", y="bill_depth_mm",
    marker="+", s=100, marginal_kws=dict(bins=25, fill=False),
)
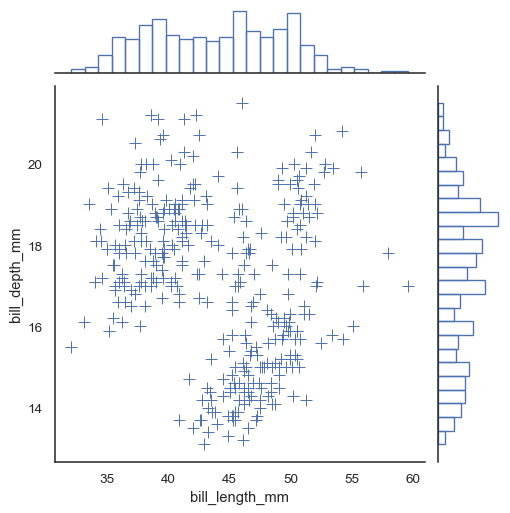
使用
JointGrid参数控制图形的大小和布局。sns.jointplot(data=penguins, x="bill_length_mm", y="bill_depth_mm", height=5, ratio=2, marginal_ticks=True)
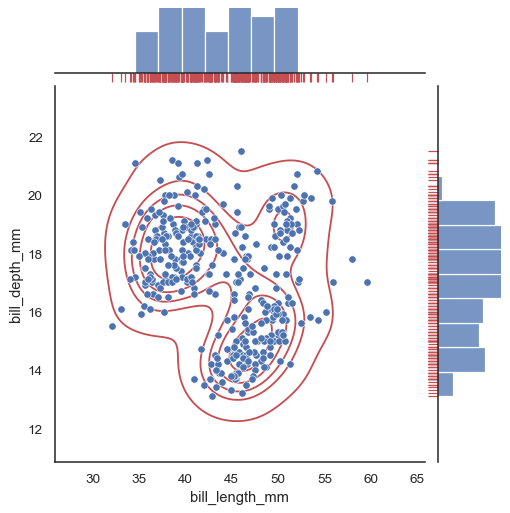
要向绘图中添加更多层,请使用
JointGrid对象上的方法,该对象由jointplot()返回。g = sns.jointplot(data=penguins, x="bill_length_mm", y="bill_depth_mm") g.plot_joint(sns.kdeplot, color="r", zorder=0, levels=6) g.plot_marginals(sns.rugplot, color="r", height=-.15, clip_on=False)
